AE 11: Opinion articles in The Chronicle
Suggested answers
Application exercise
Answers
Important
These are suggested answers. This document should be used as reference only, it’s not designed to be an exhaustive key.
Part 1 - Data scraping
See chronicle-scrape.R for suggested scraping code.
Part 2 - Data analysis
Let’s start by loading the packages we will need:
- Load the data you saved into the
datafolder and name itchronicle.
chronicle <- read_csv("data/chronicle.csv")- Who are the most prolific authors of the 500 most recent opinion articles in The Chronicle?
chronicle |>
  count(author, sort = TRUE)
# A tibble: 193 × 2
author n
<chr> <int>
1 Luke A. Powery 30
2 Anna Garziera 25
3 Aaron Siegle 23
4 Monday Monday 23
5 Advikaa Anand 15
6 Nik Narain 14
7 Leo Goldberg 13
8 Remembrances 13
9 Alex Berkman 11
10 Heidi Smith 10
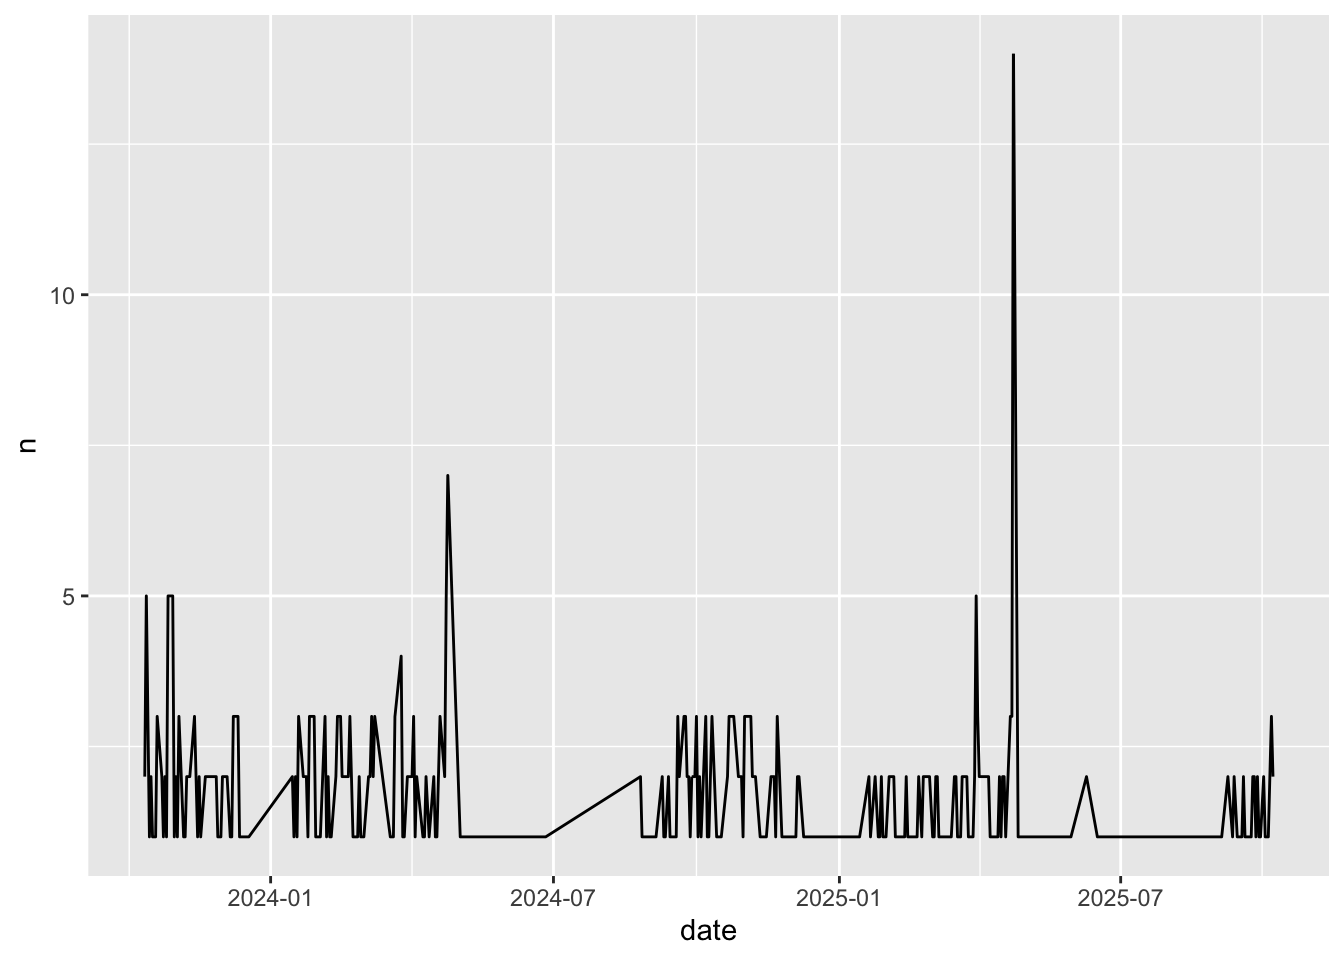
# ℹ 183 more rows- Draw a line plot of the number of opinion articles published per day in The Chronicle.
- What percent of the most recent 500 opinion articles in The Chronicle mention “climate” in their title?
chronicle |>
  mutate(
    title = str_to_lower(title),
    climate = if_else(
      str_detect(title, "climate"),
      "mentioned",
      "not mentioned"
    )
  ) |>
  count(climate) |>
  mutate(prop = n / sum(n))
# A tibble: 2 × 3
climate n prop
<chr> <int> <dbl>
1 mentioned 8 0.016
2 not mentioned 492 0.984- Come up with another question and try to answer it using the data.
# add code here