AE 13: stupid plots to amuse your friends
The ggimage package provides the geom_image layer and the image aesthetic for using image files to customize the points in a scatterplot.
Let’s consider this cast of characters in the images/scatter-points/ directory:


Level 1
Goal: replace every point with an image of your choice.
img <- "images/scatter-points/orange.png"

ggplot(mtcars, aes(x = wt, y = mpg)) +
  geom_image(aes(image = img), size = 0.1)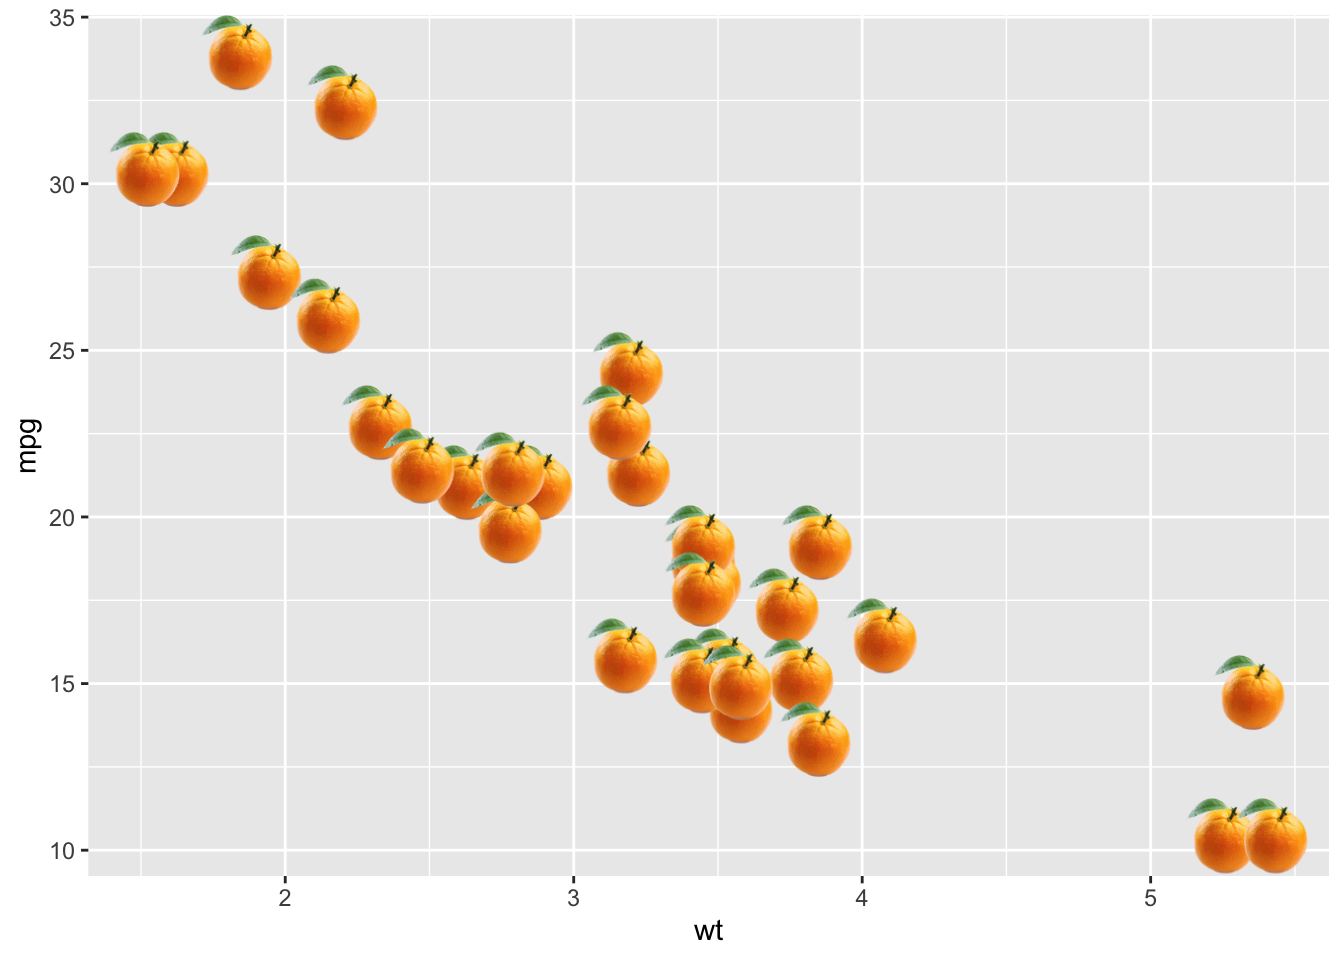
I’ve found that the size argument in geom_image is a bit counterintuitive in its effect, so definitely tinker with that.
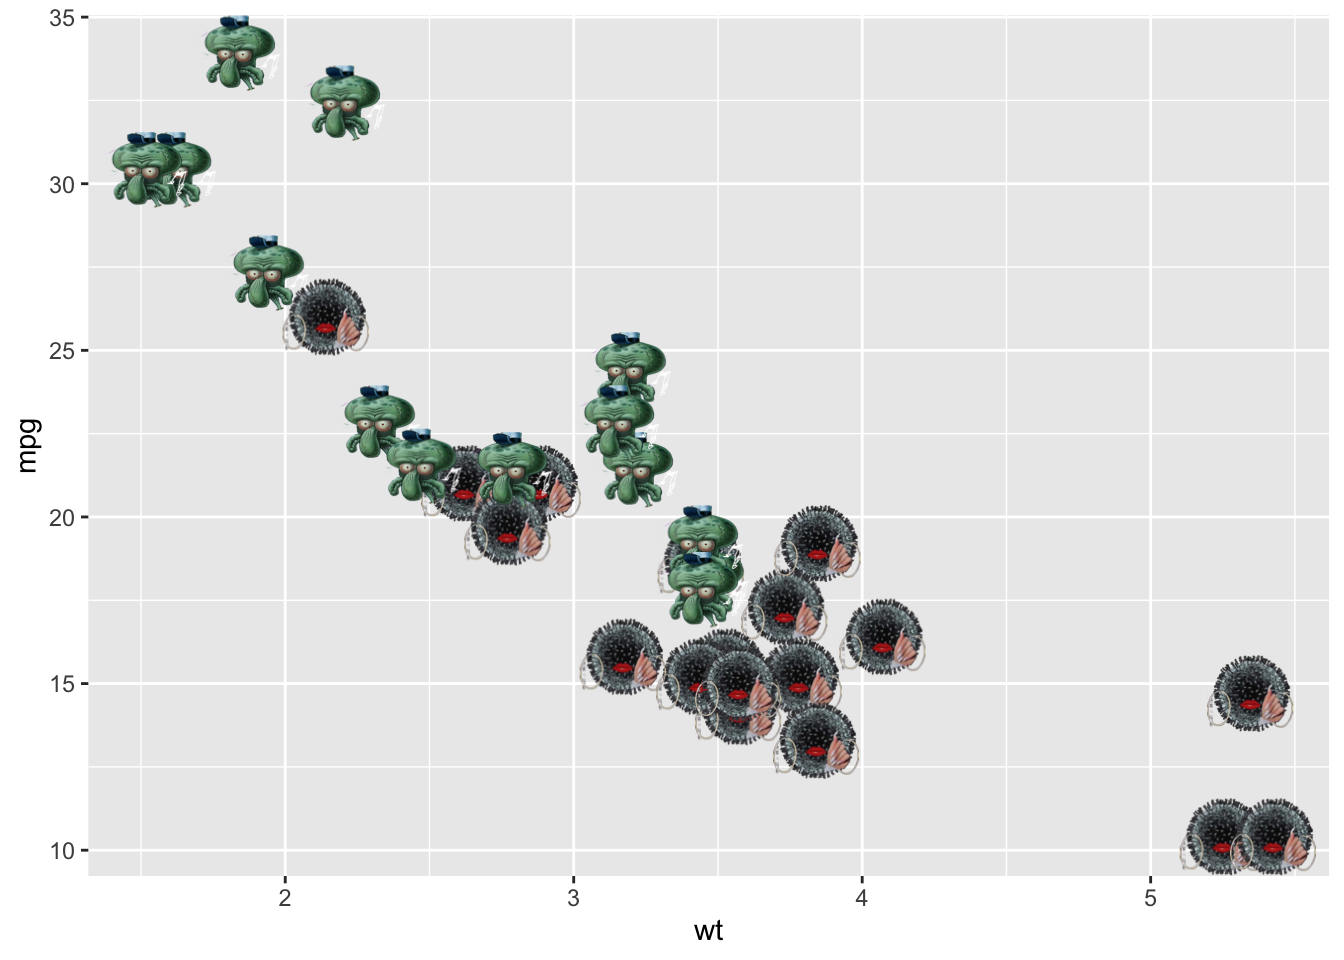
Level 2
Goal: adjust the image according to the value of vs.
Level 3
Replacing every point with the custom image can be computationally intensive, especially when you have a lot of points and the image file is high resolution. You can ease the burden by decreasing the size of your image file. The magick package makes this easy:
library(magick)

img_name <- "images/scatter-points/miss-rona.png"
img <- image_read(img_name)
img_small <- image_resize(img, "75%")
image_write(img_small, "images/scatter-points/miss-rona-small.png")